Graphs and Tables
A graph is a visual, concise means of presenting information; a table presents facts and figures in compact form.
There are three basic kinds of graphs: a circle or pie graph, a bar graph, and a line graph.
Circle/Pie Graph
In studying circle graphs, you should determine:
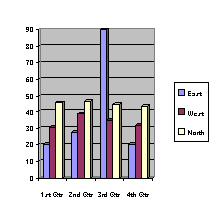
Bar Graph
When studying bar graphs, you should ask:
Line Graph
Line graph are made up of three important parts--the vertical axis, the horizontal axis, and the diagonal line, which shows the relationship between the figures on the vertical axis and those on the horizontal.
In studying line graphs, you should:
Tables
When reading tables, you should:
(From Integrating College Study Skills)
Making Inferences from Graphs and Tables
Graphs and tables are visual representations which can give information both directly and indirectly. In other words, readers sometimes may have to make inferences or draw conclusions based on the data given as well as their knowledge of the world.
Following are some expressions we may use when making inferences:
From the information given, I conclude that _____________________.
infer that _________________________.
assume that _______________________.
From the information given, it can be decided that _________________.
concluded that _______________.
inferred that _________________.
assumed that ________________.
The information (in the text/ in Figure…) implies that ______________.
suggests that _____________.
hints that ________________.
Verb forms used with inferences
may/might/could/ must + infinitive form of the verb
(without to)
Example: " I can smell gas. The pipe must be broken.
may/might/could/must + have + past participle of the verb
Example: The multiple explosion at the LPG filling station near Klong Ton must have been caused by a gas leak. The station attendants may have been careless with the gas.
Describing Graphs and Tables
The information contained in a graph or a table can also be expressed in words. The following are some useful expressions describing graphs and tables.
|
1. X |
make up |
amount of Y. |
|
|
account for |
|
|
|
be responsible for |
|
|
|
contribute to |
|
|
|
constitute |
|
e.g.
According to Figure 1, food garbage makes up 17% of the total solid waste collected in the United States in 1975.|
a. |
Adjective |
Noun |
|
|
slight |
rise |
|
|
slow |
increase |
|
|
gradual |
decrease |
There is/was/has been a steady decline in X.
|
|
marked fall dramatic drop sharp rapid sudden |
|
b. |
Verb |
Adverb |
|
|
|
X |
rise |
slightly |
|
|
increase |
slowly |
|
|
|
decrease |
gradually |
|
|
|
decline |
steadily |
|
|
|
fall |
markedly |
|
|
|
drop |
dramatically |
|
e.g.
It can be seen from Figure 3 that the concentration of sulfur dioxide increases sharply from September and falls dramatically from December.(The Division of English for Science and Technology,
Chulalongkorn University Language Institute)
Go to ===>
EAP Page