Download Chapter IV : Results and Discussion
Download Chapter V : Conclusion
CHAPTER IV
RESULTS AND DISCUSSION
In all experiments the concentration of SDS and calcium ions remained below Ksp and CMC to prevent precipitation and formation of calcium didodecyl sulfate complex micelle. The value of concentration-based Ksp of calcium didodecyl sulfate at 30OC was 6.0´ 10-3 M3 (Riviello., 1997) and the activity-based Ksp was 5.02´ 10-3 M3 (Stellner et al., 1989). The CMC of SDS at 30OC was 8300 m M (Mukerjee et al., 1970). The conditions of pH chosen in experiments were of 7 and 9. The temperature of all experiments was constant at 30OC.
4.1 Effect of Calcium Ions on the Adsorption of SDS on the Paper Fiber
Adsorption isotherms were generated showing the relationship between the SDS and calcium ions. Figures 4.1 and 4.2 depicted the adsorption of calcium ions on the surface of paper fiber at pH 7 and pH 9. Both curves had similar shapes of adsorption. The calcium ions were attached by negatively charged sites of the paper fiber resulting from ionization of carboxyl and hydroxyl group on paper surface and alkaline condition on shear layer of paper fiber (Riviello., 1997). At equilibrium calcium concentration of 25,000
mM, the calcium loading on surface was 15 mmol/m2. It appeared that surface was not completely covered by calcium. If there was more calcium added, the paper fiber would be capable of better adsorption.The adsorption isotherm of SDS on paper fiber at pH 7 was shown in Figure 4.3 and one at pH 9 was shown in Figure 4.4. Both curves appeared to be S-shape according to Rosen (1989). At higher pH, paper fiber carried more negative charged sites, so the adsorption of SDS on paper fiber should be
Figure 4.1 Adsorption isotherm of calcium on paper fiber with no SDS at
pH 7 at 30OC; vary initial calcium concentration.
Figure 4.2 Adsorption isotherm of calcium on paper fiber with no SDS at
pH 9 at 30OC; vary initial calcium concentration.
Figure 4.3 Adsorption isotherm of SDS on paper fiber with no calcium at
pH 7 at 30OC; vary initial SDS concentration.
Figure 4.4 Adsorption isotherm of SDS on paper fiber with no calcium at
pH 9 at 30OC; vary initial SDS concentration.tail down orientation, leaving the negative head group outward to the solution, so called hydrophobic interaction. The result showed that the plateau adsorption of SDS at pH of 7 was approximately 0.5
mmol/m2 corresponding to 3,000 mM (less than CMC of SDS) but the plateau adsorption of SDS at pH 9 corresponding to 8,000 mM (near CMC of SDS).Figure 4.5 is a replot between the adsorption isotherms of SDS and calcium on paper fiber at pH 7 shown previously in Figure 4.1 and 4.3. At equilibrium SDS concentration at approximately 3,000
mM, the plateau adsorption of SDS was approximately 0.5 mmol/m2.But calcium adsorption curve denoted by diamond showed that fiber had more adsorption capacity on calcium than on SDS. At concentration of 800-3,000 mM the SDS adsorption increased while calcium curve leveling off which meant the SDS affinity to paper fiber was higher than was calcium affinity.
Figure 4.5 Adsorption isotherms of SDS and calcium on paper fiber at pH 7 at 0OC;(n ) vary initial SDS concentration, (u ) vary initial calcium concentration.
Figure 4.6 shows relationship between adsorbed SDS and equilibrium SDS in the presence of various initial calcium concentrations at pH 7. The same relationship was obtained at pH 9 as shown in Figure 4.7. Both curves in Figures 4.6 and 4.7 revealed that addition of various amounts of calcium did not have much change in adsorbed SDS. Because the calcium concentrations of 100 and 1,000 m M were not high enough to be cooperative adsorption for increasing the SDS adsorption capacity. Figures 4.8 and 4.9 show the relationship of SDS and calcium adsorbed on paper fiber at pH 7 and 9. AT initial calcium concentration of 100 m M, the initial SDS concentration was varied but calcium surface loading still remained constant at 0.015 mmol/m2.
Figure 4.6 Adsorption isotherms of SDS with varying initial calcium concentration at pH 7 at 30OC; (s ) vary initial SDS concentration, (u ) vary initial SDS concentration and constant initial calcium concentration 100
mM, (n ) vary initial SDS concentration and constant initial calcium concentration 1,000 mM.
Likewise, at initial calcium concentration of 1,000
mM, SDS adsorption could not reach the full adsorption capacity on paper fiber and the calcium loading was constant at 0.15 mmol/m2 with various SDS concentration. It is suggested that the amount of calcium was not high enough to induce bridging mechanism with SDS on paper fiber, because there were some adsorbed SDS unreacted and not participating in calcium adsorption. However, there are several possible adsorption mechanisms for calcium and anionic surfactant on the layer of fiber in high saline condition depending on the solution conditions and concentration of surfactant and calcium (Rutland et al., 1997).
Figure 4.7 Adsorption isotherms of SDS with varying initial calcium concentration at pH 9 at 30OC; (s ) vary initial SDS concentration, (u ) vary initial SDS concentration and constant initial calcium concentration 100
mM, (n ) vary initial SDS concentration and constant initial calcium concentration 1,000 mM.
Figure 4.8 Adsorption isotherms of calcium and SDS with varying initial calcium concentration at pH 7 at 30OC; (u ) vary initial SDS concentration and constant initial calcium concentration 100
mM, (n ) vary initial SDS concentration and constant initial calcium concentration 1,000 mM.
Figure 4.9 Adsorption isotherms of calcium and SDS with varying initial calcium concentration at pH 9 at 30OC;(u ) vary initial SDS concentration and constant initial calcium concentration 100
mM, (n ) vary initial SDS concentration and constant initial calcium concentration 1,000 mM.
When pH of system was changed, H+ and OH- were the potential determining ions for the paper fiber surface. Figure 4.10 illustrates the comparison of the SDS adsorption on paper fiber at pH 7 and 9. These data also suggested that the surfactant had greater affinity for fiber in solution at pH 7 than one at pH 9. This is probably due to OH- ions covering more on surface at pH 9, in turn, causing increase in electrostatic repulsion between SDS and surface. It should be noted that at the SDS equilibrium concentration below CMC (8300 m M), the SDS adsorption capability at pH 7 was twice as much as one at pH 9. At equilibrium SDS concentration beyond CMC, both adsorption isotherms approached the same capacity of 0.5 m mol/m2 for both pH.
Figure 4.10 Adsorption isotherms of SDS with no calcium and varying pH at 30OC ; (s ) vary initial SDS concentration at pH 7, (u ) vary initial SDS concentration at pH 9.
Figure 4.11 shows the relationship between calcium adsorption and equilibrium calcium concentration at both pH conditions. Both curves were similar and almost superimposed, which was suggested that pH had no effect to calcium adsorption on paper fiber. Because there was the electrostatic force between calcium ions and paper surface greater than the effect from OH- ions. SDS adsorption on paper fiber in the presence of varying initial concentration of calcium ions and varying pH were shown in Figures 4.12 and 4.13. In all cases, increasing pH from 7 to 9 caused a decrease in SDS adsorption by half due to OH- ions covering more on surface at pH 9.
The adsorption isotherm of calcium in the presence of initial SDS concentration of 100 m M and 1000 m M were shown in Figures 4.14 and 4.15. From both Figures, changing pH had no effect on calcium adsorption. The change of pH had direct effect only on SDS adsorption.
Figure 4.11 Adsorption isotherms of calcium with no SDS and varying pH at 30OC; (s ) vary initial calcium concentration at pH 7, (u ) vary initial calcium concentration at pH 9.
Figure 4.12 Adsorption isotherms of SDS with initial calcium concentration 100 m M and varying pH at 30OC; (s ) vary initial SDS concentration and constant calcium concentration 100 m M at pH 7, (u ) vary initial SDS concentration and constant calcium concentration 100 m M at pH 9.
Figure 4.13 Adsorption isotherms of SDS with initial calcium concentration 1,000 m M and varying pH at 30OC; (s ) vary initial SDS concentration and constant calcium concentration 1,000 m M at pH 7, (u ) vary initial SDS concentration and constant calcium concentration 1,000 m M at pH 9.
Figure 4.14 Adsorption isotherms of calcium and SDS with initial calcium concentration 100 m M and varying pH at 30OC; (u ) vary initial SDS concentration and constant calcium concentration 100 m M at pH 7, (n ) vary initial SDS concentration and constant calcium concentration 100 m M at pH 9.
Figure 4.15 Adsorption isotherms of calcium and SDS with initial calcium concentration 1,000 m M and varying pH at 30OC; (u ) vary initial SDS concentration and constant calcium concentration 1,000 m M at pH 7, (n ) vary initial SDS concentration and constant calcium concentration 1,000 m M at pH 9.
4.3 Effect of SDS and Calcium Ions to the Zeta Potential of Paper Fiber
Figure 4.16 illustrates the zeta potential of the paper fiber in the absence of calcium at pH 7. Adding SDS caused the absolute magnitude of negative zeta potential decrease by approximately 7 mV, from 28 to 21 mV, with SDS adsorption on the surface even though the adsorbed molecules carried a negative charge. Because SDS adsorbed on the fiber with the configuration as shown in Figure 4.17. This configuration was horizontal lay-down which made the hydrophobic part of SDS molecules cover on the negatively charged sites of the fiber resulting in decrease of zeta potential. In all cases, increasing calcium concentration at pH 7 further decreased the absolute magnitude of zeta potential as shown in Figure 4.18 because calcium ions compressed of the electrical diffuse double layer around the negatively charged particles. The compression of electrical diffuse double layer resulted in diminishing electrostatic repulsion between the particles. Adding 100 m M of calcium to system made the absolute magnitude of zeta potential decrease approximately 1 mV. Increasing calcium concentration up to 1,000 m M to system caused the absolute magnitude of zeta potential decrease by approximately 2.5 mV and 5 mV at equilibrium SDS concentration less than 600 m M and higher than 600 m M, respectively.
Figure 4.16 Zeta potential of paper fiber as a function of equilibrium SDS concentration with no calcium at pH 7 at 30OC; (u ) vary initial SDS concentration.
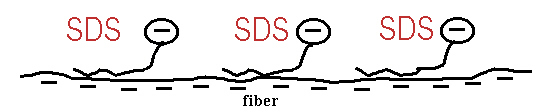
Figure 4.17 The Schematic of The SDS Adsorption On Paper Fiber.
Figure 4.18 Zeta potential of paper fiber as a function of equilibrium SDS concentration with varying calcium concentration at pH 7 at 30OC; (s ) vary initial SDS concentration, (u ) vary initial SDS concentration and constant calcium concentration 100 m M, (n ) vary initial SDS concentration and constant calcium concentration 1,000 m M.
4.4 Effect of pH to the Zeta Potential of Paper Fiber
Figure 4.19 illustrates the zeta potential of the paper fiber in the absence of added calcium with varying pH. The ability of SDS adsorption at pH 7 was reduced by half compared to one at pH 9 in the range of equilibrium SDS concentration below CMC. At equilibrium SDS concentration above CMC, both SDS adsorption isotherms at pH 7 and at pH 9 were almost the same. The presence of 100 m M and 1000 m M of calcium ions are shown in Figures 4.20 and 4.21. The same tendency still occured in both presence and absence of Ca2+ concentration. At pH 9, decreasing in SDS adsorption caused the absolute magnitude of zeta potential increase by approximately 3 mV. Beyond CMC, both SDS adsorption isotherms at pH 7 and 9 were almost the same, the absolute magnitude of zeta potential decreased by approximately 1 mV.